Survey Scale Optimization Analysis
Evaluating response format efficiency for citizen satisfaction surveys
Overview
I analyzed whether a 10-point satisfaction scale in a civic survey could be reduced to 5 or 7 points without losing information quality. Using histogram comparison techniques on public service ratings from 1,200+ Ciudad Juárez residents, I identified which service questions could benefit from scale reduction and which required the full 10-point range.
Business Problem
Survey design directly impacts data quality. Longer scales (1-10) provide granular data but increase cognitive load for respondents—especially those with lower education levels—potentially reducing response consistency and quality. Shorter scales (5 or 7 points) are easier to answer and can improve response reliability, but only if they preserve the underlying information structure.
Key question: Can we simplify our survey to improve response quality without sacrificing analytical depth?
Technical Approach
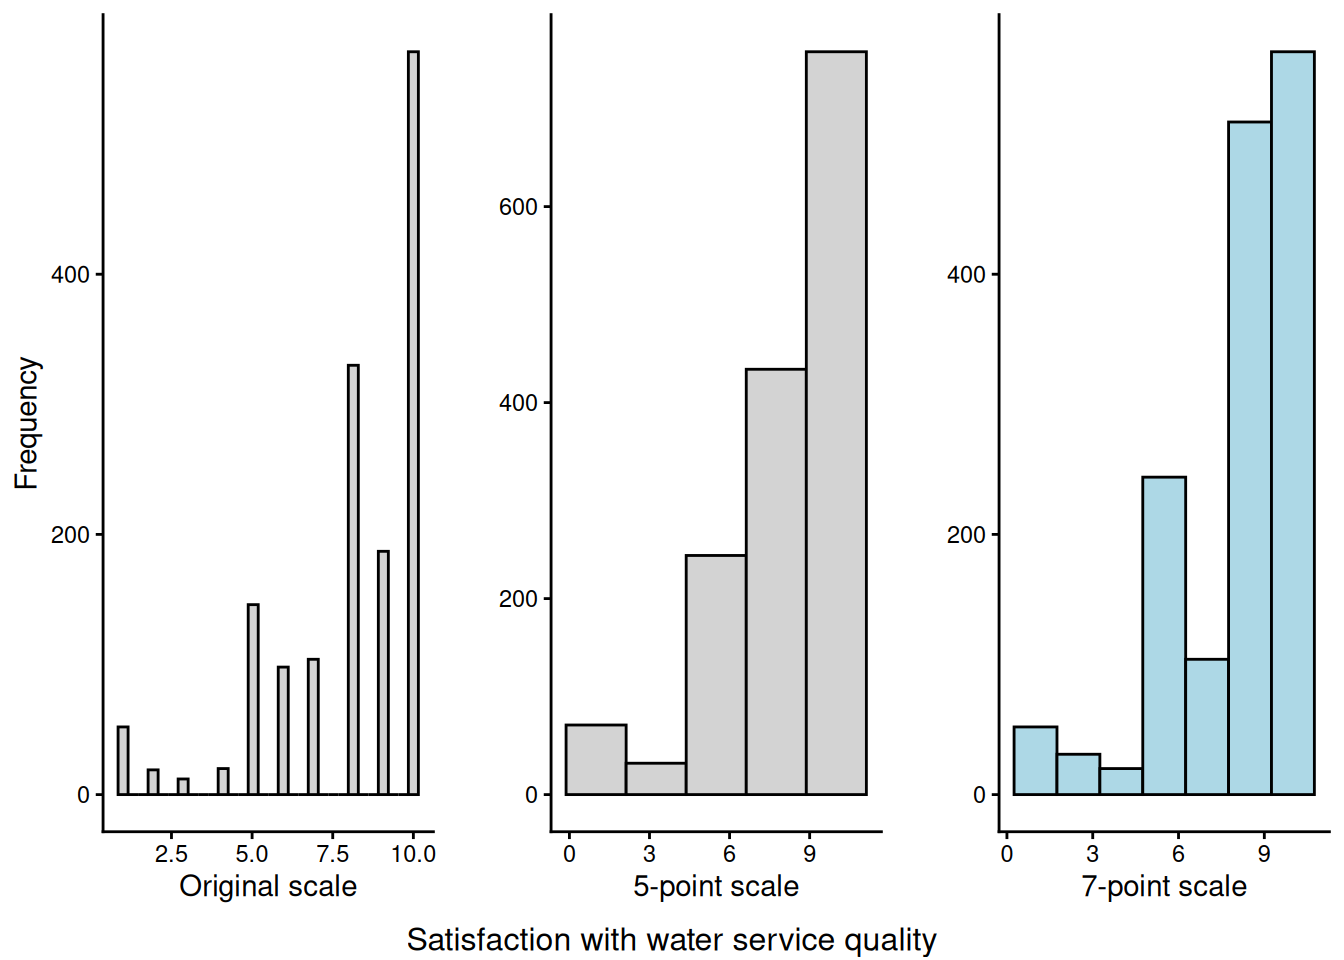
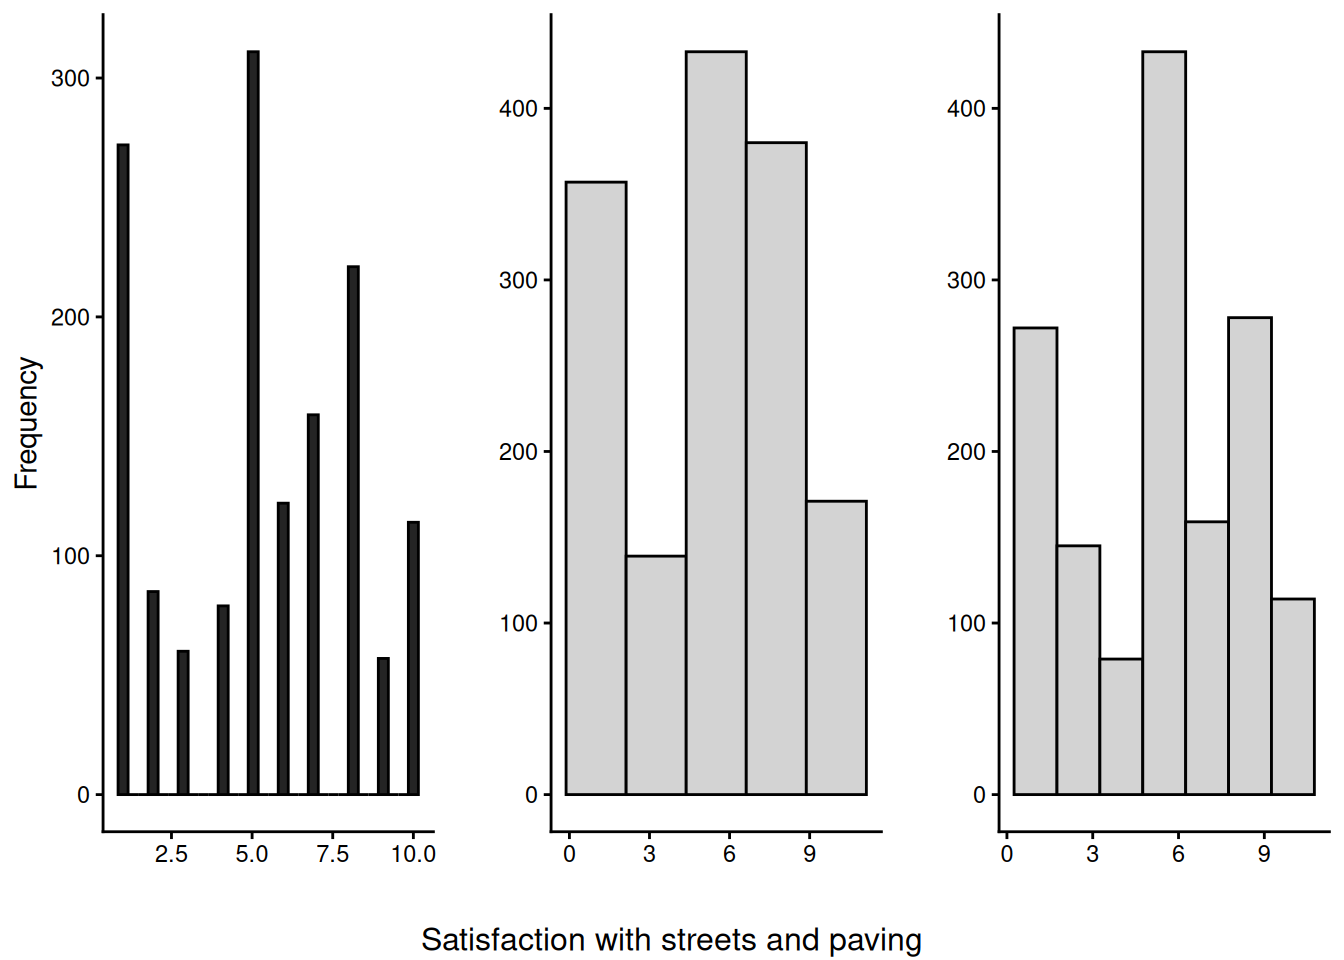
Data source: Así Estamos Juárez 2022 citizen perception survey (N=1,200+) Method: Visual histogram comparison using R and ggplot2 Analysis: For 10 public service satisfaction questions, I created three histogram versions: - Original 10-point scale - Simulated 5-point scale - Simulated 7-point scale
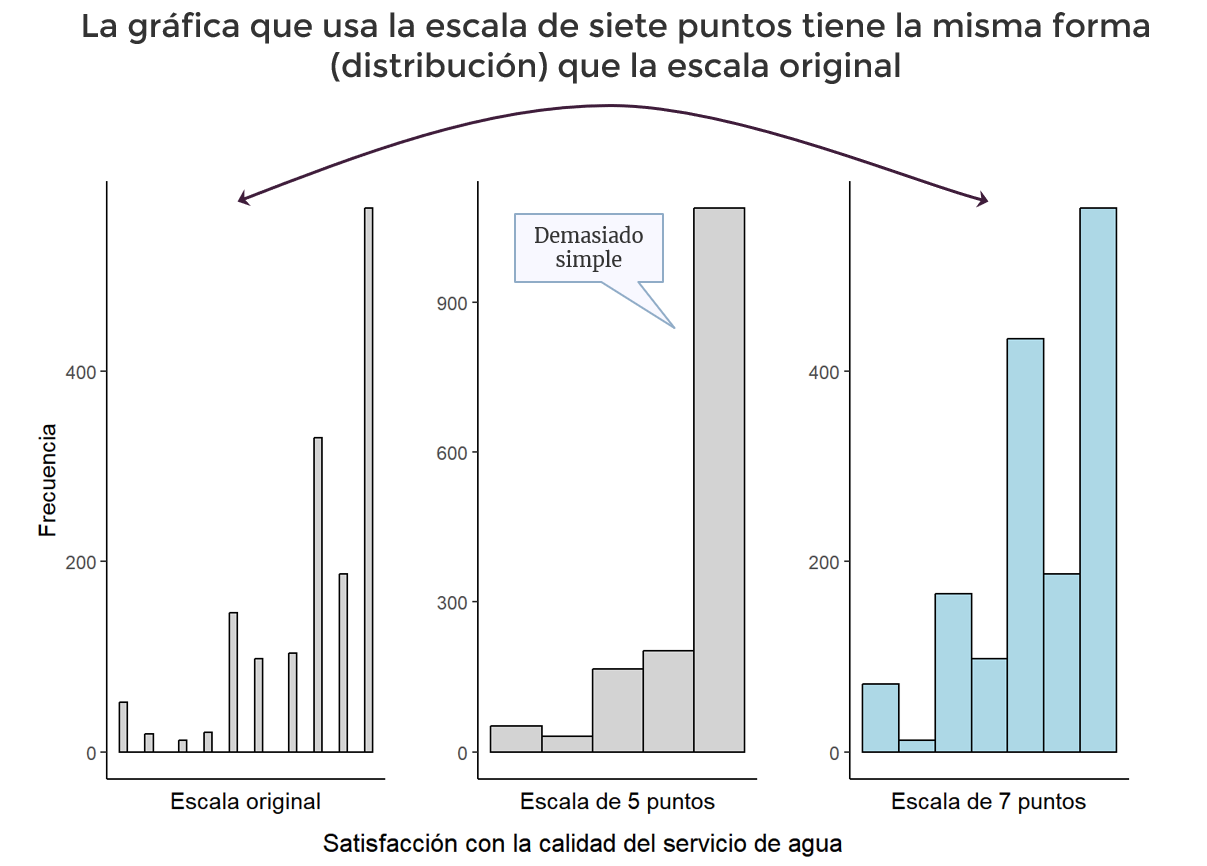
Similar histogram shapes indicate that scale reduction preserves information; different shapes signal information loss.
Results
| Public Service | 5-point scale | 7-point scale |
|---|---|---|
| Water | Similar | Identical |
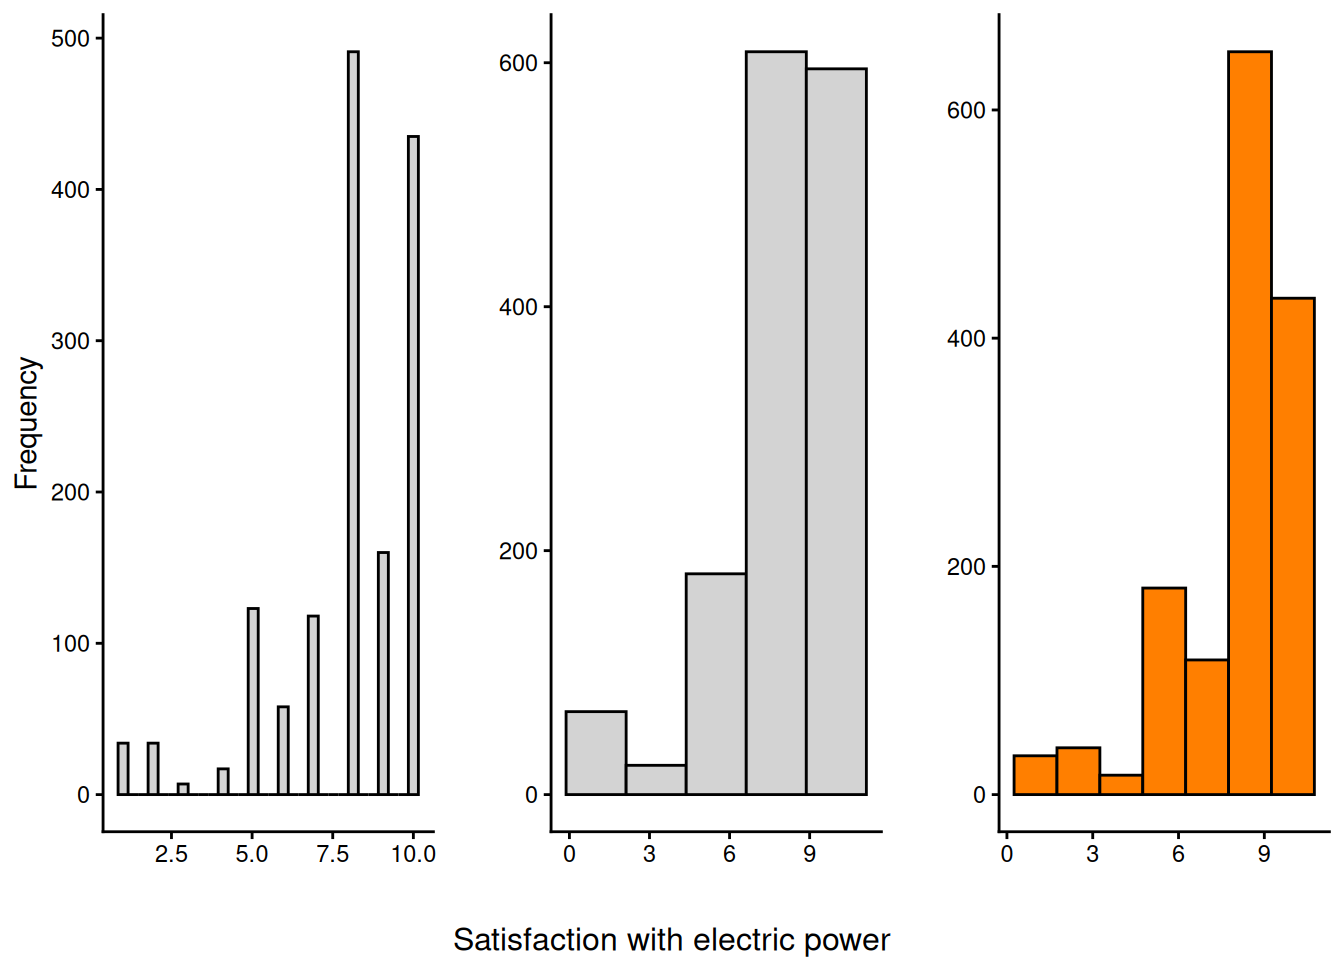
| Electric power | Similar | Identical |
| Public lighting | Similar | Different |
| Traffic signals | Different | Identical |
| Road signs | Different | Similar |
| Semi-massive transport | Different | Identical |
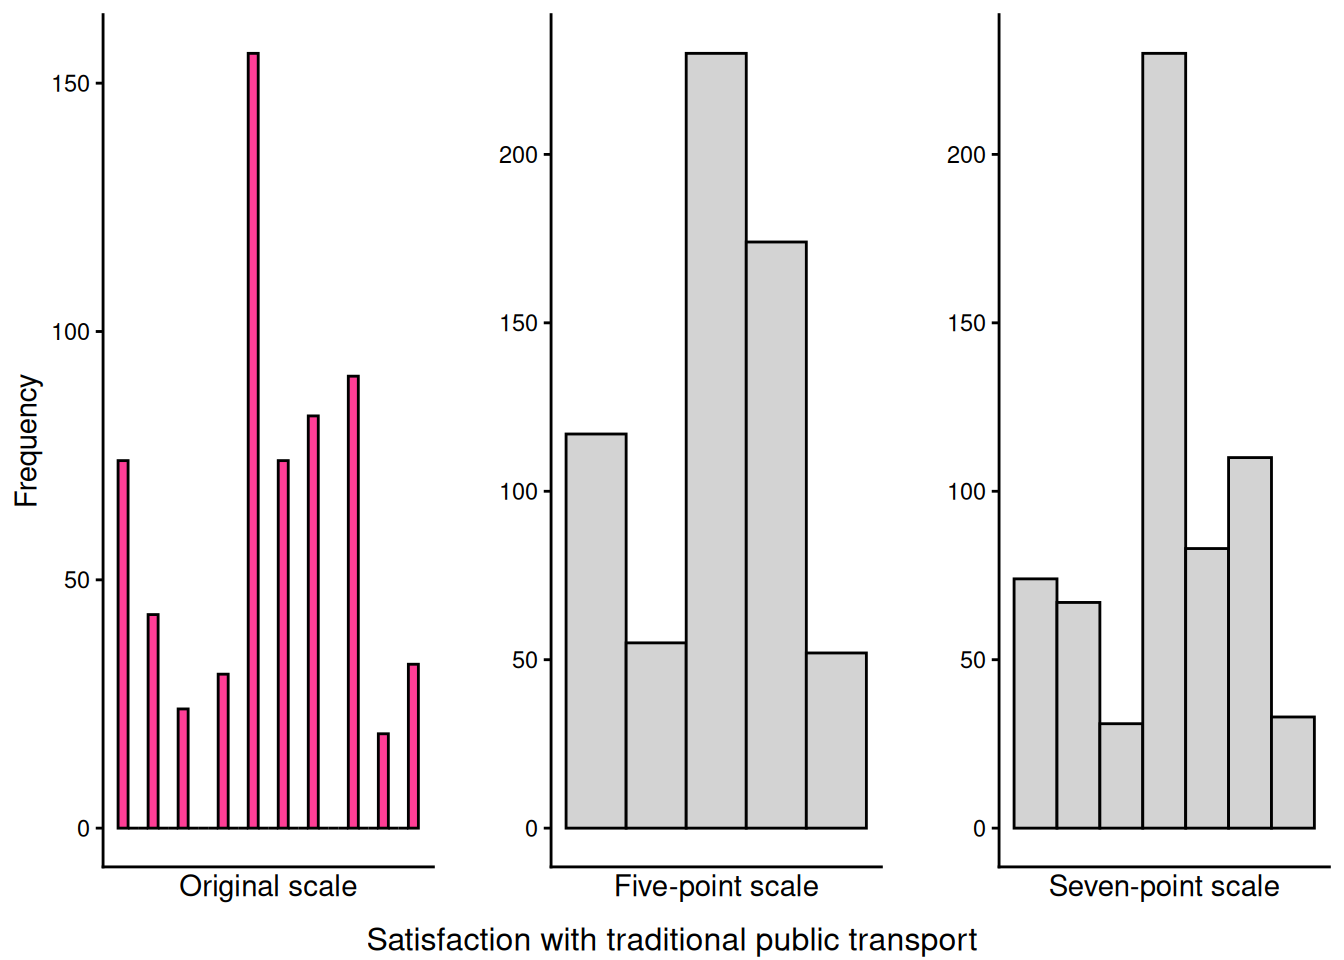
| Traditional transport | Different | Different |
| Garbage collection | Different | Different |
| Green areas | Different | Different |
| Streets and paving | Different | Different |
Key finding: 60% of questions (6/10) could use a 7-point scale without information loss, but the remaining 40% show significant distribution changes when reduced.
Pattern observed: Questions with lowest satisfaction scores (paving, green areas, traditional transport) showed the most data dispersion and were most affected by scale reduction—suggesting these polarizing topics genuinely require more granular measurement.
Recommendation
Maintain the 10-point scale across all questions.
While 6 questions could technically use a 7-point scale, mixing scale types within a single survey creates its own cognitive burden. The consistency of using one scale throughout the survey outweighs the marginal benefits of question-specific optimization.
Alternative consideration: If redesigning from scratch, a uniform 7-point scale could work, but would sacrifice nuance on controversial services where citizens have strong, varied opinions.
Technical Details
NoteDetailed methodology & visualizations
The analysis used the haven package to import SPSS data and ggplot2 for visualization. For each question, I created histograms using: - Original scale: geom_histogram() with default bins - 5-point scale: bins=5 parameter - 7-point scale: bins=7 parameter
Examples where 7-point scale preserves information:
Examples where scale reduction loses information:
Reference: Finn, R. H. (1972). Effects of Some Variations in Rating Scale Characteristics on the Means and Reliabilities of Ratings. Educational and Psychological Measurement, 32(2), 255-265.
Tools used: R, ggplot2, tidyverse, haven Data source: Plan Estratégico de Juárez - Así Estamos Juárez 2022