Espejo Ciudadano - Citizen Perception Dashboard
Interactive R Shiny platform for visualizing civic data from Ciudad Juárez
Executive Summary
Espejo Ciudadano (Citizen Mirror) is an interactive R Shiny dashboard developed for Así Estamos Juárez that visualizes citizen perception and participation data in Ciudad Juárez. The application presents survey results across multiple thematic areas including government, wellness, infrastructure, participation, and urban planning, allowing citizens to explore quality-of-life indicators in an intuitive and accessible manner.
🔗 Live Site: asiestamosjuarez.org
Project Context
Client Organization
Así Estamos Juárez is a civic monitoring initiative that collects and analyzes quality-of-life data in Ciudad Juárez. The organization conducts annual citizen perception and participation surveys to generate evidence that informs public dialogue and decision-making.
Problem Statement
The organization needed a digital platform that would: - Democratize access to complex civic data - Enable temporal comparisons (2023-2024) - Integrate survey data with government data sources - Provide an intuitive user experience for non-technical audiences - Scale to handle multiple years and survey types
Technical Solution
Application Architecture
I developed a modular single-page R Shiny application with the following features:
System Architecture:
├── Frontend: R Shiny + Bootstrap 5.3.1
├── Backend: R data processing
├── Database: SQLite for analytics
├── Deployment: Docker + Traefik + Let's Encrypt SSL
└── Data: Surveys + Government Data (Mexico)
Technology Stack
Core: - R Shiny: Main framework for interactive web application - tidyverse: Data manipulation and transformation - ggplot2: High-quality data visualizations - sf: Geospatial data processing - leaflet: Interactive district-level maps
Infrastructure: - Docker: Containerization for consistent deployment - Traefik: Reverse proxy with automatic SSL - Let’s Encrypt: SSL/TLS certificates - SQLite: Integrated analytics system
Data Analysis: - SPSS/Excel Import: Survey data processing - GeoJSON: Geographic data visualization - memoise: Caching for performance optimization
Key Features
1. Modular Design by Thematic Areas
The application organizes information into 5 main thematic areas:
Quality of Life
Economics, recreation, identity, environment, healthcare, education
Urban Mobility
Public transit, pedestrian movement
Institutions
Trust, accountability, representation, expectations
Infrastructure
Public services, housing, facilities
Civic Participation
Community engagement and citizen involvement
2. Data Visualization System
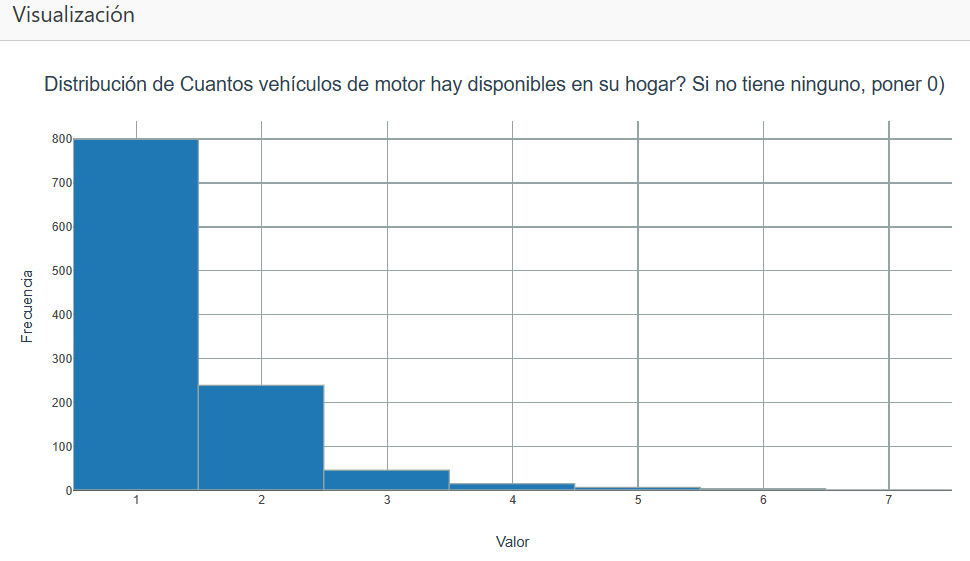
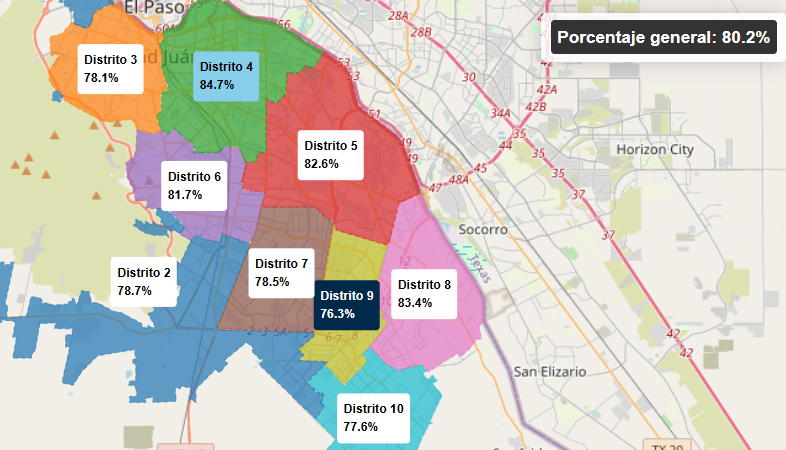
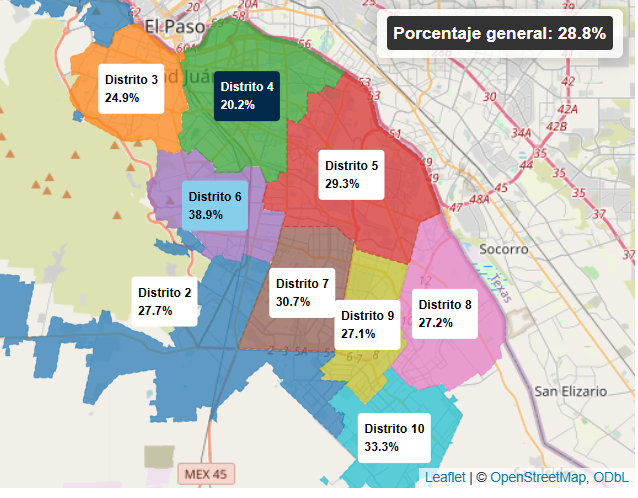
Implemented Visualization Types: - Comparative bar charts by district - Time series for trend analysis - Interactive choropleth maps with Leaflet - Indicator dashboards with key metrics - Frequency distributions for categorical data
Example visualization code:
# Automatic question classification system
question_classifier.R detects question type
→ Routes to appropriate module (bar_chart, map, time_series)
→ Applies consistent visual theme
→ Pre-caches results for performance
3. Multi-Source Data Integration
The application integrates: - Survey Data: Citizen perception (PER_2023, PER_2024) - Participation Data: Civic engagement (PAR_2023, PAR_2024) - Government Data: Official statistics from Mexico - Geographic Data: District boundaries in GeoJSON format
4. Integrated Analytics System
I developed a custom analytics system to track usage:
AnalyticsManager Class:
├── Session tracking with duration analysis
├── Section engagement metrics
├── User interaction logging
├── Daily usage statistics
└── Data export capabilities
Analytics Triggers: - Keyboard: Ctrl+Shift+A - UI: Triple-click “Vista Rápida” title - Console: showAnalytics() function
5. Performance Optimization
Implemented Strategies: - Extensive caching: Use of memoise for expensive operations - Pre-computation: Plots and percentages stored as .rds - Background loading: Asynchronous data pre-loading - Efficient data management: data_manager.R optimizes loading - Multi-core processing: Limited to 4 cores in Docker
Project Visualizations

Technical Challenges and Solutions
Challenge 1: Scalable Modular Architecture
Problem: Need to add new themes and years without major refactoring
Solution: Implemented modular system with *_ui.R / *_server.R pairs:
R/
├── wellness/wellness_ui.R + wellness_server.R
├── government/government_ui.R + government_server.R
└── [New modules follow same pattern]
Challenge 2: Multi-Survey Configuration
Problem: Different surveys use different column names and encodings
Solution: Created survey_config.R with centralized mappings:
survey_config.R:
├── Column mappings (district, gender, age)
├── Categorical value mappings
└── Survey-specific configurations
Challenge 3: Performance with Large Datasets
Problem: Slow loading times with real-time calculations
Solution: 3-stage processing pipeline:
1. Pre-processing → data/processed/ (CSV)
2. Pre-computation → data/plots/ (.rds)
3. In-memory caching → memoise + data_manager
Challenge 4: Secure Production Deployment
Problem: Need for HTTPS, SSL, and monitoring
Solution: Complete Docker stack:
docker-compose.yml:
├── Shiny App Container (Port 3838)
├── Traefik Reverse Proxy
├── Let's Encrypt automatic SSL
└── Security header configuration
Data Pipeline
graph LR
A[Raw Data<br/>Excel/SPSS] --> B[Cleaning<br/>CSV]
B --> C[Classification<br/>question_classifier]
C --> D[Pre-computed<br/>Visualizations]
D --> E[Presentation<br/>UI Modules]- Raw Data: Excel/SPSS files in
data/raw/ - Processing: Cleaning and classification
- Processed Data: Clean CSVs in
data/processed/ - Visualization: Pre-computed plots stored as
.rds - Presentation: Modular UI components present the data
Code Examples
Automatic Question Classification
# question_classifier.R
classify_question <- function(question_data) {
  if (is_geographic(question_data)) {
    return(list(type = "map", module = "map_module"))
  } else if (is_temporal(question_data)) {
    return(list(type = "timeseries", module = "timeseries_module"))
  } else if (is_categorical(question_data)) {
    return(list(type = "bar", module = "bar_chart_module"))
  }
}
Analytics System
# analytics.R
AnalyticsManager <- R6Class("AnalyticsManager",
  public = list(
    log_interaction = function(session_id, section, action) {
      dbWriteTable(conn, "interactions", data.frame(
        session_id = session_id,
        section = section,
        action = action,
        timestamp = Sys.time()
      ), append = TRUE)
    },

    get_section_metrics = function() {
      dbGetQuery(conn, "
        SELECT section, COUNT(*) as visits,
               AVG(duration) as avg_duration
        FROM sessions
        GROUP BY section
      ")
    }
  )
)
Results and Impact
✅ Successful Deployment: Live site at asiestamosjuarez.org ✅ User Experience: Intuitive interface accessible to non-technical audiences ✅ Performance: Fast loading times with pre-computed data and caching ✅ Scalability: Modular architecture supports multiple years and survey types ✅ Security: HTTPS with automatic SSL via Let’s Encrypt ✅ Analytics: Tracking system provides usage insights
Performance Metrics: - Initial load time: < 3 seconds - Visualization interaction: Instantaneous (pre-cached) - Multi-device support: Desktop, tablet, mobile - Availability: 99.9% uptime with Docker
Future Work and Potential Improvements
Technical Skills Demonstrated
This project showcases proficiency in:
R Shiny Development Interactive web applications, modular design, performance optimization
Data Science Survey analysis, data visualization, multi-source integration
DevOps & Deployment Docker, Traefik, SSL/TLS, CI/CD, infrastructure management
Geospatial Analysis GeoJSON processing, Leaflet maps, district-level analysis
Software Architecture Modular design, state management, separation of concerns
Database Systems SQLite, schema design, optimized queries, analytics
Conclusion
The Espejo Ciudadano project represents my ability to develop real-world data applications that serve the public interest. By combining survey data analysis, government data integration, interactive visualization, and modern deployment, I created a platform that empowers citizens with accessible and actionable information.
This project demonstrates not only technical competence in R Shiny and data science, but also the ability to translate complex stakeholder requirements into robust, scalable, and user-centric software solutions.
Technologies: R Shiny, Docker, Traefik, ggplot2, leaflet, SQLite, Bootstrap, GeoJSON Repository: Private (client) Live Site: asiestamosjuarez.org Client: Así Estamos Juárez - Civic Monitoring Initiative