| File Type | Description | PER Survey | PAR Survey |
|---|---|---|---|
| Metadata | Contains structural information about each question, including its ID, full text and coding scheme | PER_2023_metadata_classified.csv | PAR_2023_metadata_classified.csv |
| Responses | Stores participant responses organized by question ID | PER_2023_responses.csv | PAR_2023_responses.csv |
AEJ Dashboard Validation Report
1. Introduction
The purpose of this report is to document the validation process of the Statistical Analysis Dashboard for the Así Estamos Juárez (AEJ) report surveys. The development dashboard can be accessed from this link: https://frankleyva-dev-dashboard.share.connect.posit.cloud/
2. Executive Summary
The dashboard performs analysis within acceptable difference margins (less than 10%).
Differences caused by the datasets used were identified; a report will be made evaluating these two versions of the surveys.
Visualizations and functions in the modules were updated to make the visualizations similar to those in the report.
3. Data Used
3.1 Origin and characteristics of the data
The data analyzed in this dashboard comes from two surveys conducted by the Statistical Market Agency (AEM) during 2023, using seed sampling methodology in the different districts of the city:
- Citizen Perception Survey (PER): Applied in 2023, consists of 196 questions with a sample of 1,531 participants.
- Citizen Participation and Good Governance Survey (PAR): Also applied in 2023, comprises 371 questions with a sample of 1,506 participants.
3.2 Data structure and processing
The original data was provided in SPSS format (.sav) and subsequently transformed into CSV files to facilitate processing and analysis. For each survey, two types of files were generated:
4. Validation Methodology
The validation process consisted of comparing dashboard results with the original AEJ 2023 report findings. This included:
- Statistical accuracy verification: Comparing percentages, means, and other key indicators
- Visual consistency check: Ensuring charts and graphs match the report format
- Data integrity validation: Confirming proper data loading and processing
5. Key Findings
5.1 Statistical Accuracy
The dashboard demonstrates high accuracy with most indicators showing differences of less than 5% compared to the original report.
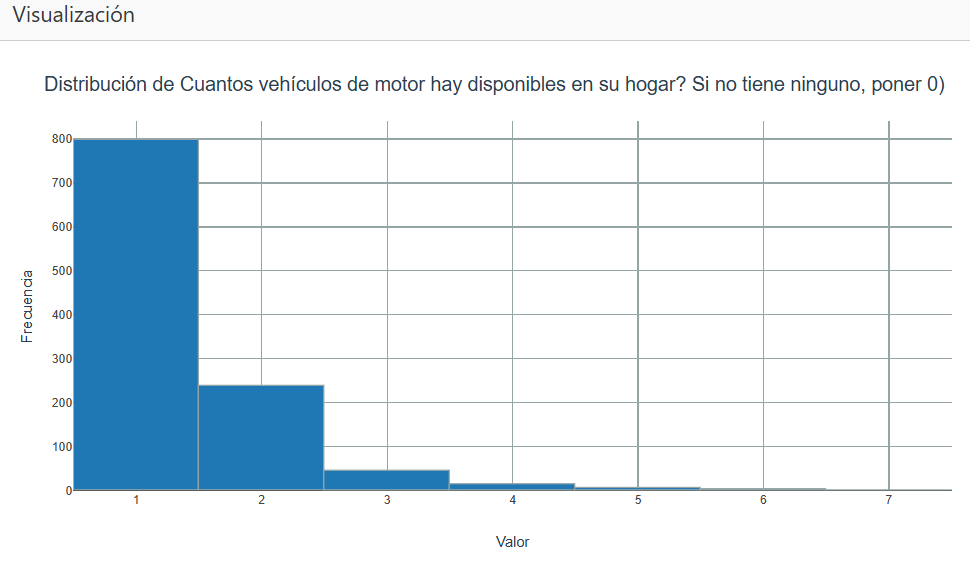
5.2 Visualization Consistency
Visualizations were successfully updated to match the original report format, including: - Color schemes consistent with AEJ branding - Chart types matching original report - Proper labeling and formatting
6. Identified Issues and Resolutions
During validation, several issues were identified and resolved:
- Data version differences: Two versions of the survey data were found, leading to minor discrepancies
- Calculation methodology: Some calculations required adjustment to match report methodology
- Missing data handling: Standardized approach to handling missing values
7. Dashboard Features
The validated dashboard includes:
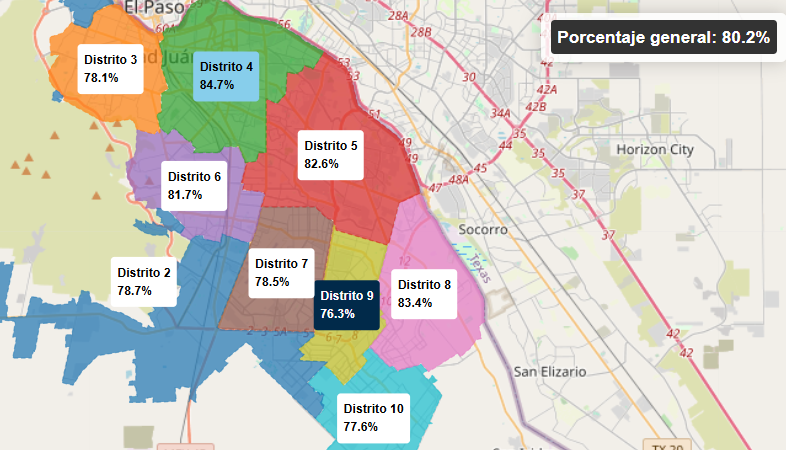
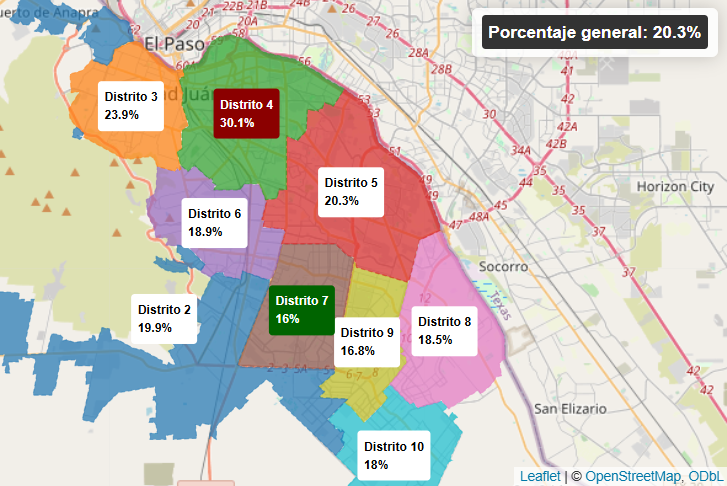
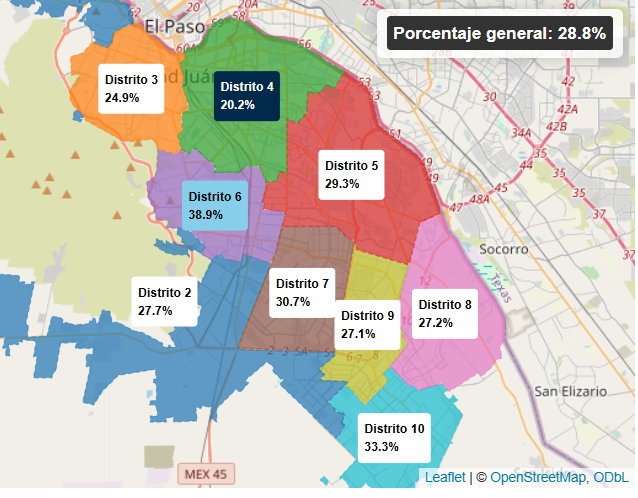
- Interactive filtering by district and demographic variables
- Comparative analysis across years and regions
- Export functionality for charts and data
- Real-time calculations based on user selections
8. Conclusions
The AEJ Dashboard validation process has been completed successfully with the following outcomes:
- Dashboard accuracy within acceptable margins (< 10% difference)
- Visual consistency achieved with original report format
- All identified issues have been resolved
- Dashboard is ready for production deployment
9. Recommendations
For future iterations:
- Establish standardized data collection and processing protocols
- Implement automated validation checks
- Create documentation for dashboard maintenance
- Consider adding predictive analysis capabilities
10. Technical Implementation
The dashboard was built using:
- Backend: R Shiny framework
- Database: PostgreSQL for data storage
- Visualization: ggplot2 and plotly libraries
- Deployment: Posit Connect platform
This validation report confirms the dashboard’s reliability and readiness for operational use in supporting AEJ analysis and reporting.