Scale Comparison
Description
The objective is to evaluate the response format used in some questions of a citizen perception survey about public services. Histograms are used where the number of responses is reduced and visually compared to see if the data distribution resembles the original scale.
Why?
Reducing the number of points in a scale can help reduce response time and increase consistency in participant responses (i.e., they are more likely to respond more authentically). In some cases, these response options are not even used, making them redundant.
Method
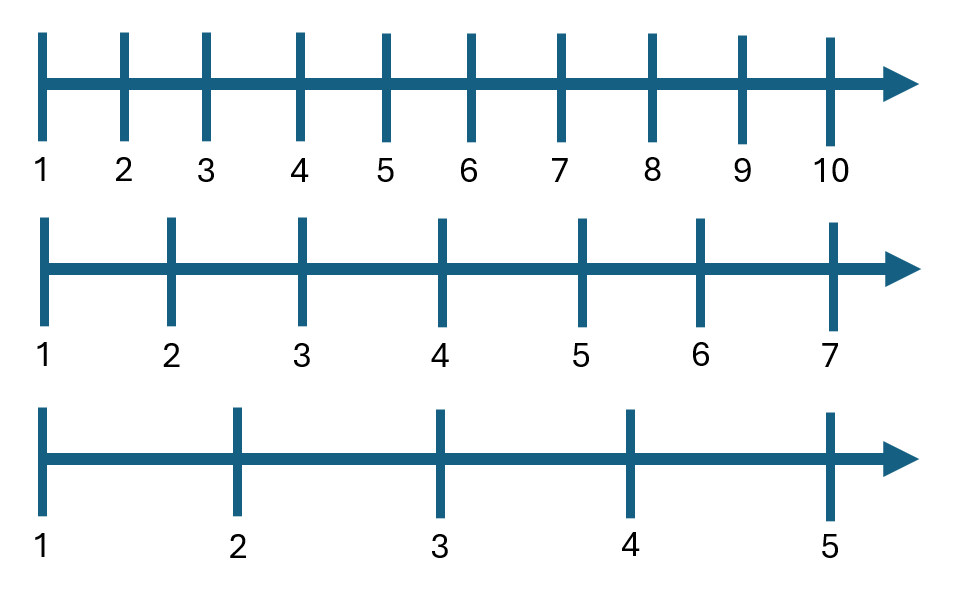
Using data from the citizen participation survey, the number of responses was reduced to five and seven options. Subsequently, the three versions of the question are plotted in histograms: the original ten-point scale, and the reduced five and seven-point scales respectively. If the graphs of the reduced versions are similar to the original, we can conclude that no information is lost by reducing the scale, which recommends its reduction.
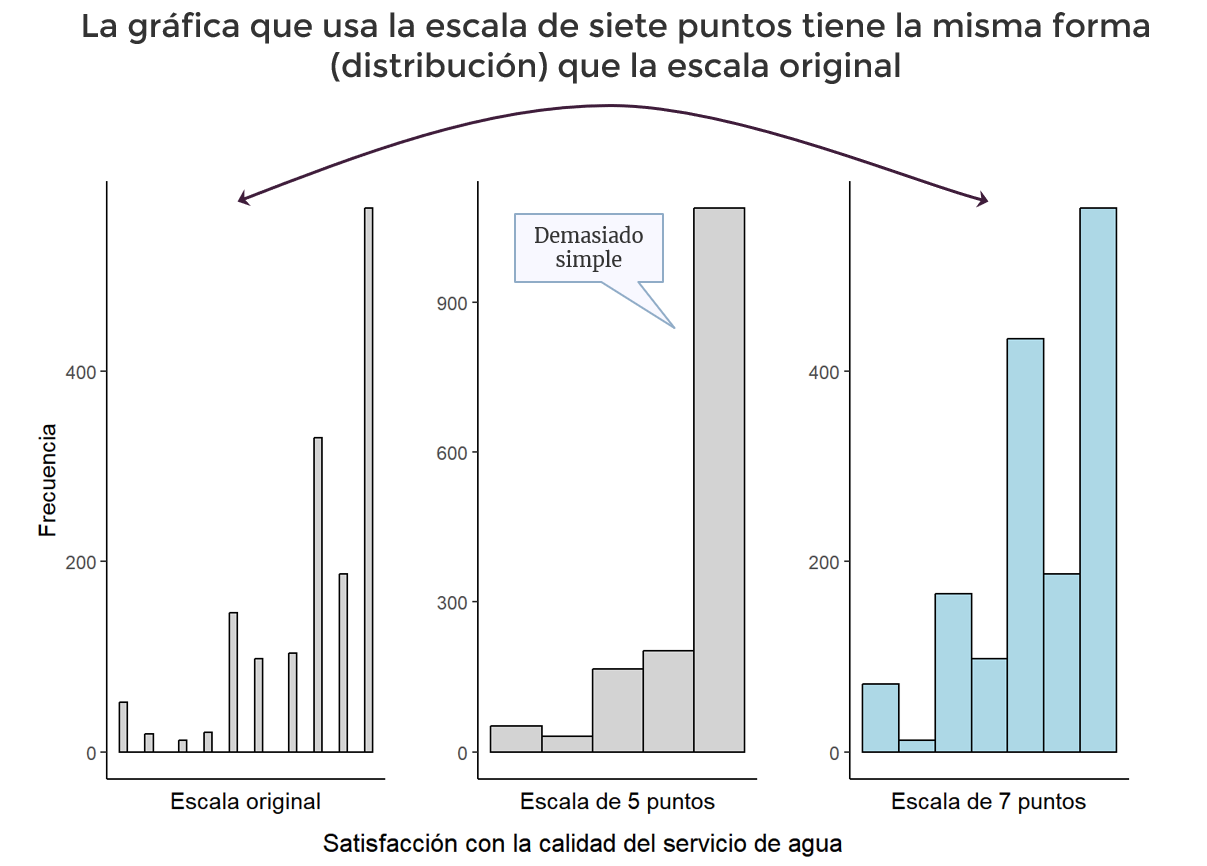
When the shape of the reduced scales is different from the original scale, this implies a different interpretation of the results due to information loss. In those cases, it is recommended to keep the original scale.

Results
The following table classifies the results of ten questions focused on citizen satisfaction with public services provided by local government. The results were classified according to the similarity of the histograms of the reduced scales compared to the histogram of the original scale.
| Public Service | Five-point scale | Seven-point scale |
|---|---|---|
| Public lighting | Similar | Different |
| Water | Similar | Identical |
| Green areas | Different | Different |
| Streets and paving | Different | Different |
| Electric power | Similar | Identical |
| Garbage collection | Different | Different |
| Traffic signals | Different | Identical |
| Road signs | Different | Similar |
| Semi-massive public transport | Different | Identical |
| Traditional public transport | Different | Different |
Conclusion
The intention of this analysis is to evaluate whether it is convenient to reduce the original ten-point scale used in the citizen participation survey. Due to the mixed results obtained, it is not recommended to change the original scale. Although there are cases where changing the scale to seven points could be beneficial, using different types of scales can be confusing for the participant and reduce the consistency of their responses.
For more detailed results check: Here