Survey Response Scale Analysis
Description
The objective of this project is to evaluate the response format used in some questions of the citizen perception survey.
Information about the data used
The data used was released by Plan Estratégico de Juárez as part of an open data initiative. The data is originally available in Excel format (.xlsx) or as a database for SPSS (.sav).
Data cleaning
To create this report, the data was imported directly from the .sav file using the haven package. Converting the data to .csv using Microsoft Excel or SPSS resulted in poor data conversion due to the complexity of the information in those formats. In this project we focus on questions Q57 to Q64, in which participants rated their level of satisfaction on a scale of one to ten for the following services:
Water.
Electric power.
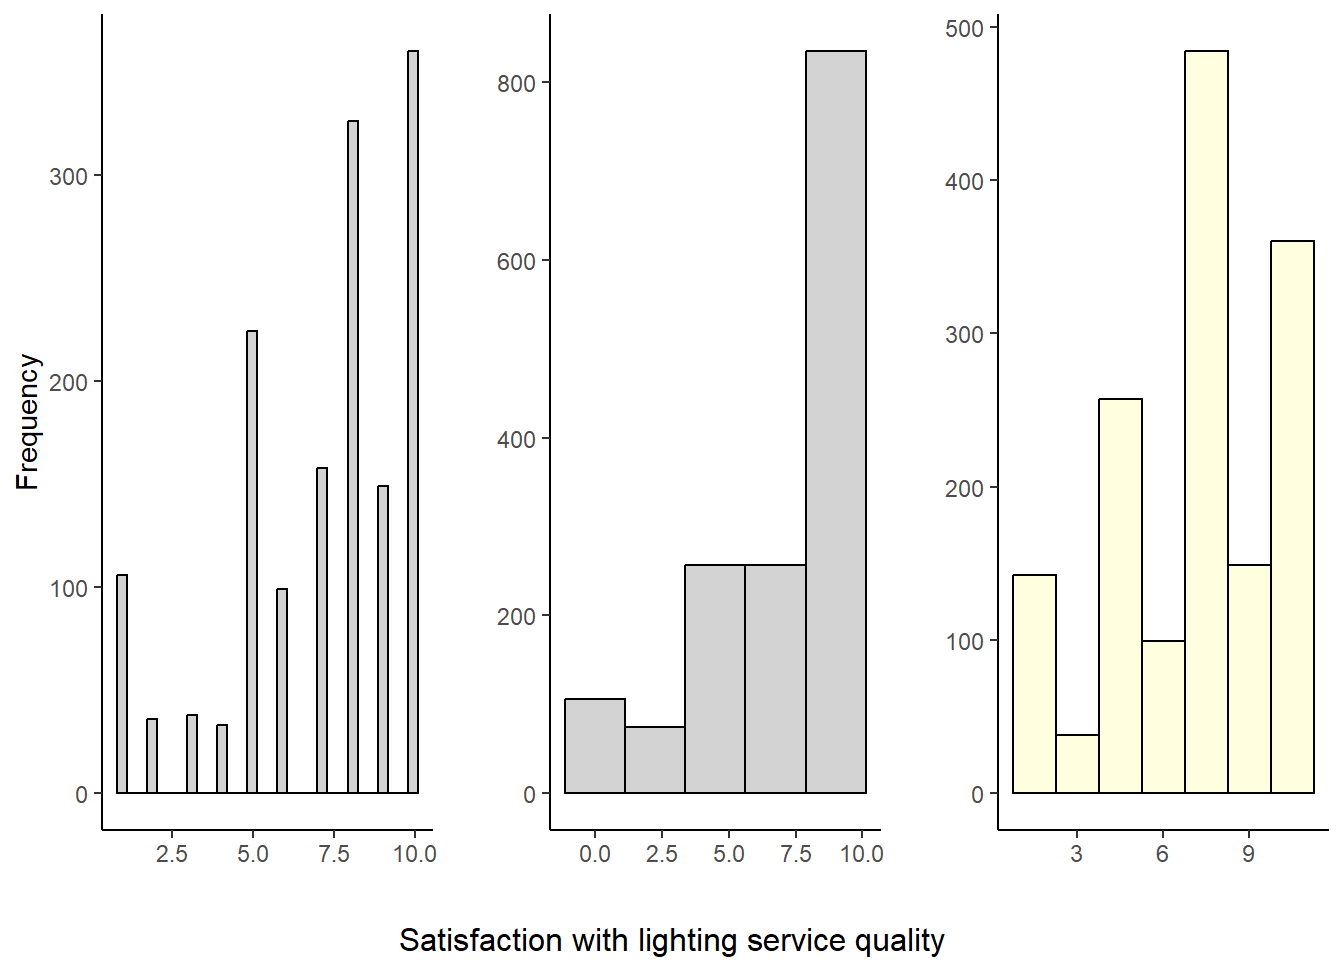
Public lighting.
Semi-massive and traditional public transport.
Garbage collection.
Road signs and traffic signals.
Availability of green areas and public space.
Streets and paving.
Descriptive report
The Así Estamos Juárez 2022 report presented satisfaction averages for the quality of public services. In addition, the report includes averages by district, as well as comparisons with previous years.
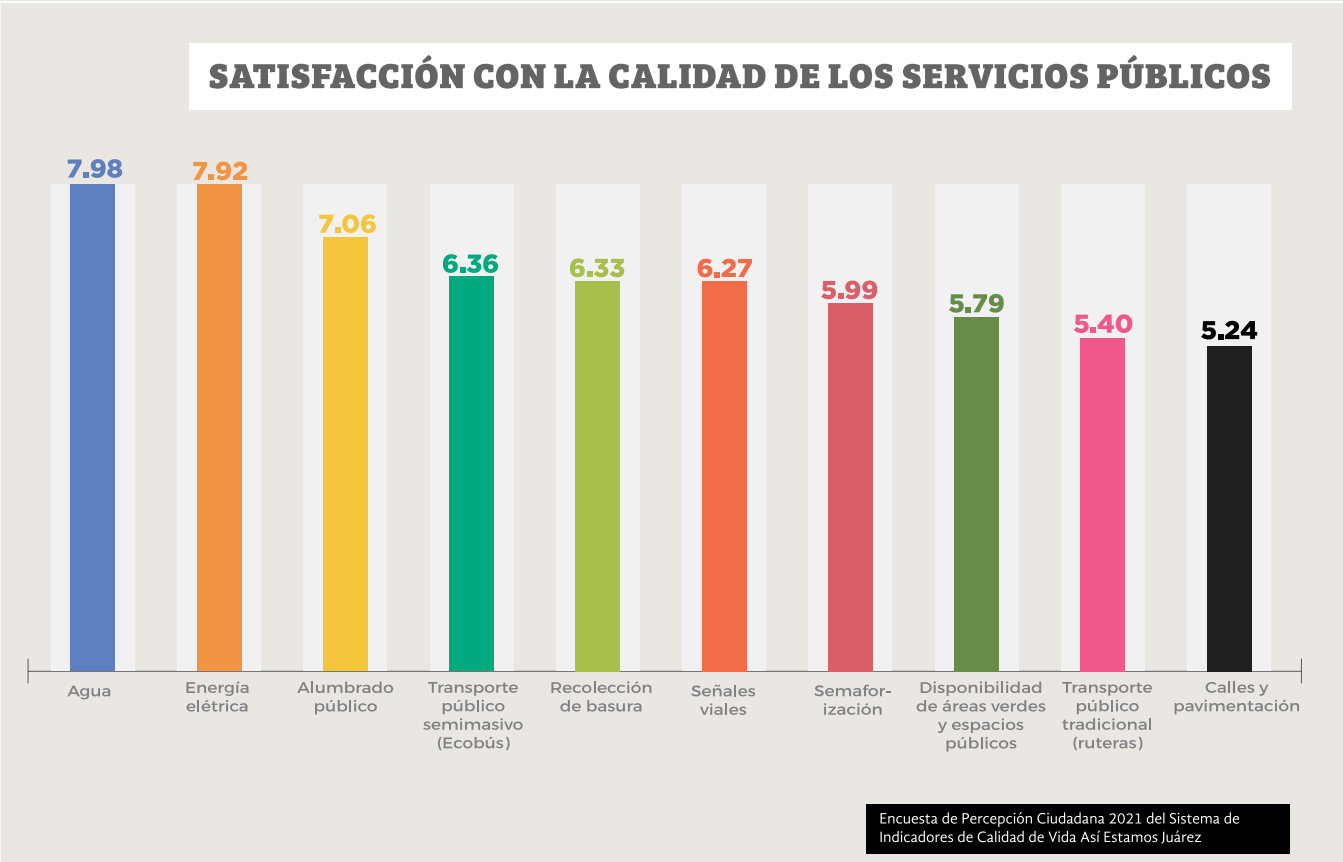
In this project I simply seek to complement the information provided in the report with specific histograms for each public service. This is for the purpose of answering the following question: Is it viable to reduce the original scale of the question (from one to ten) to a smaller number of options? If viable, reducing the scale brings two benefits: it makes the survey easier and faster to answer and consequently increases the quality of responses.
This is achieved by reducing the cognitive load of the survey, which particularly impacts participants with low education (Fowler, 1995, pp. 46-61). When there are too many options, it can be challenging for participants to understand the difference between two options. A high number of response options makes it difficult to understand the difference between answering a 3 or a 4 on a scale with ten options compared to one with five options, reducing the consistency of participants’ responses. In contrast, a smaller number of options (e.g., five or seven) can improve response reliability (Finn, 1972).
Method and results
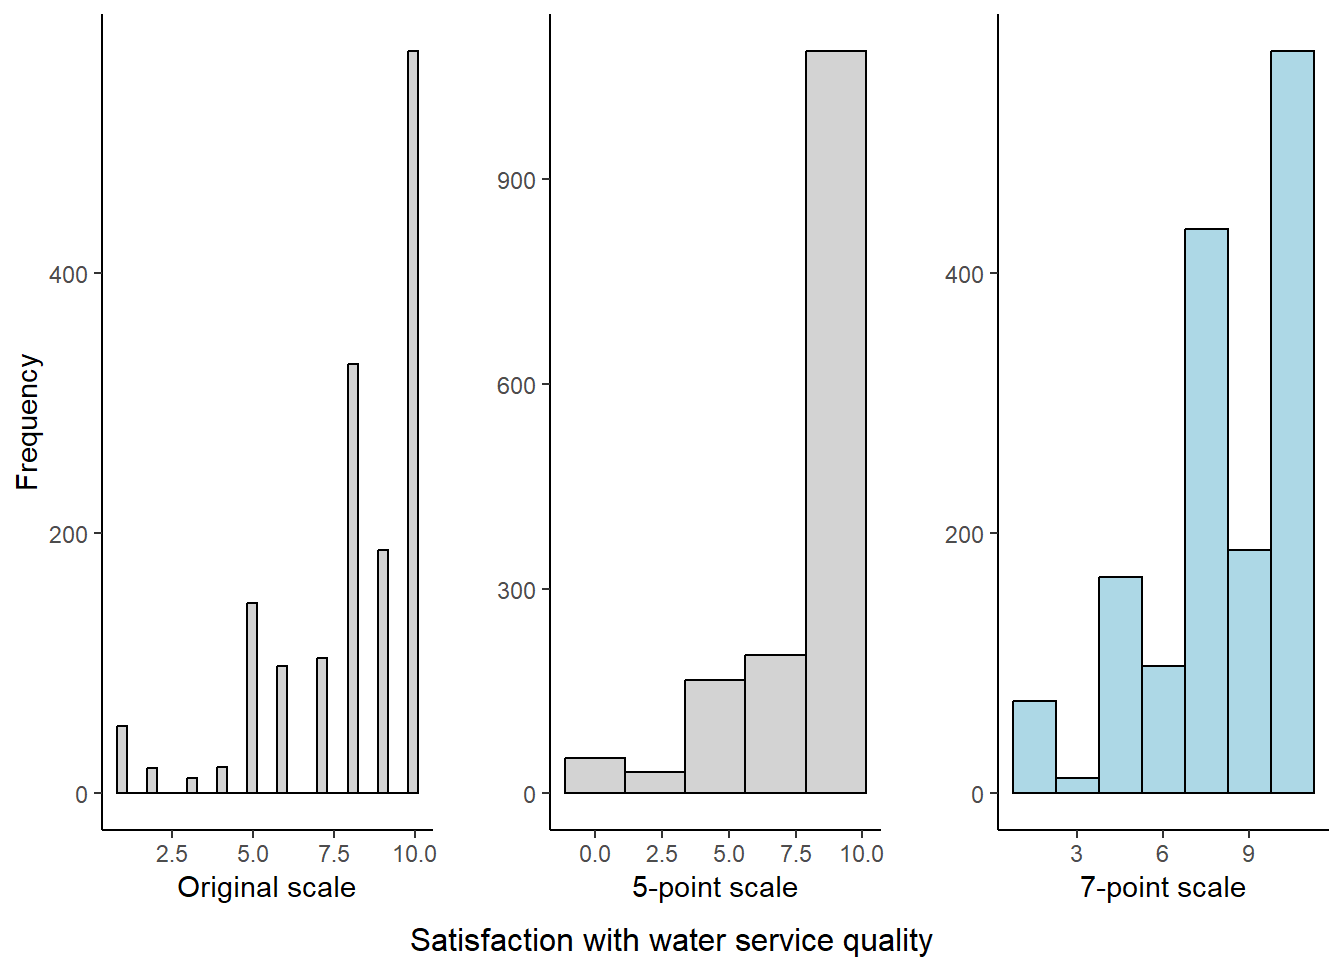
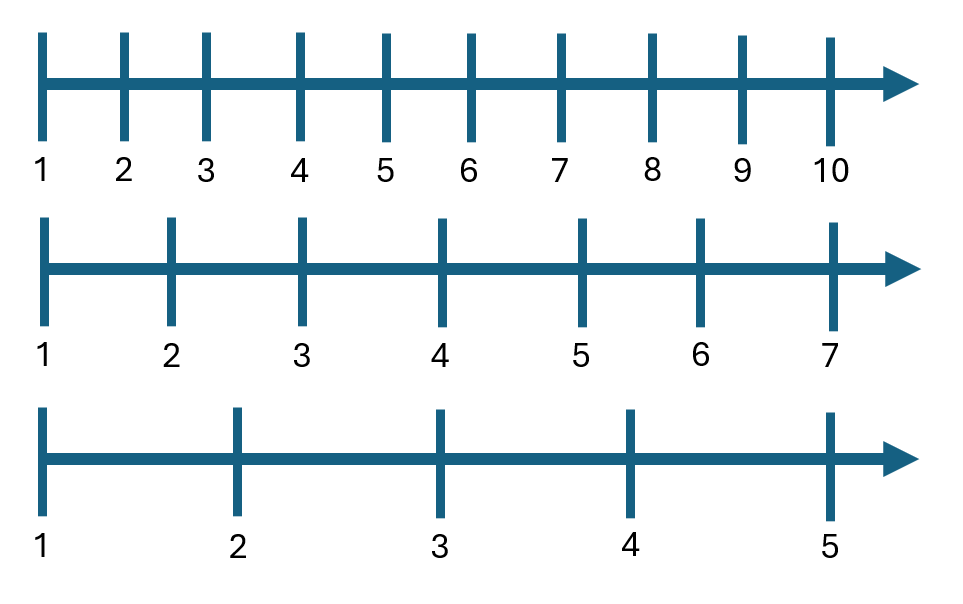
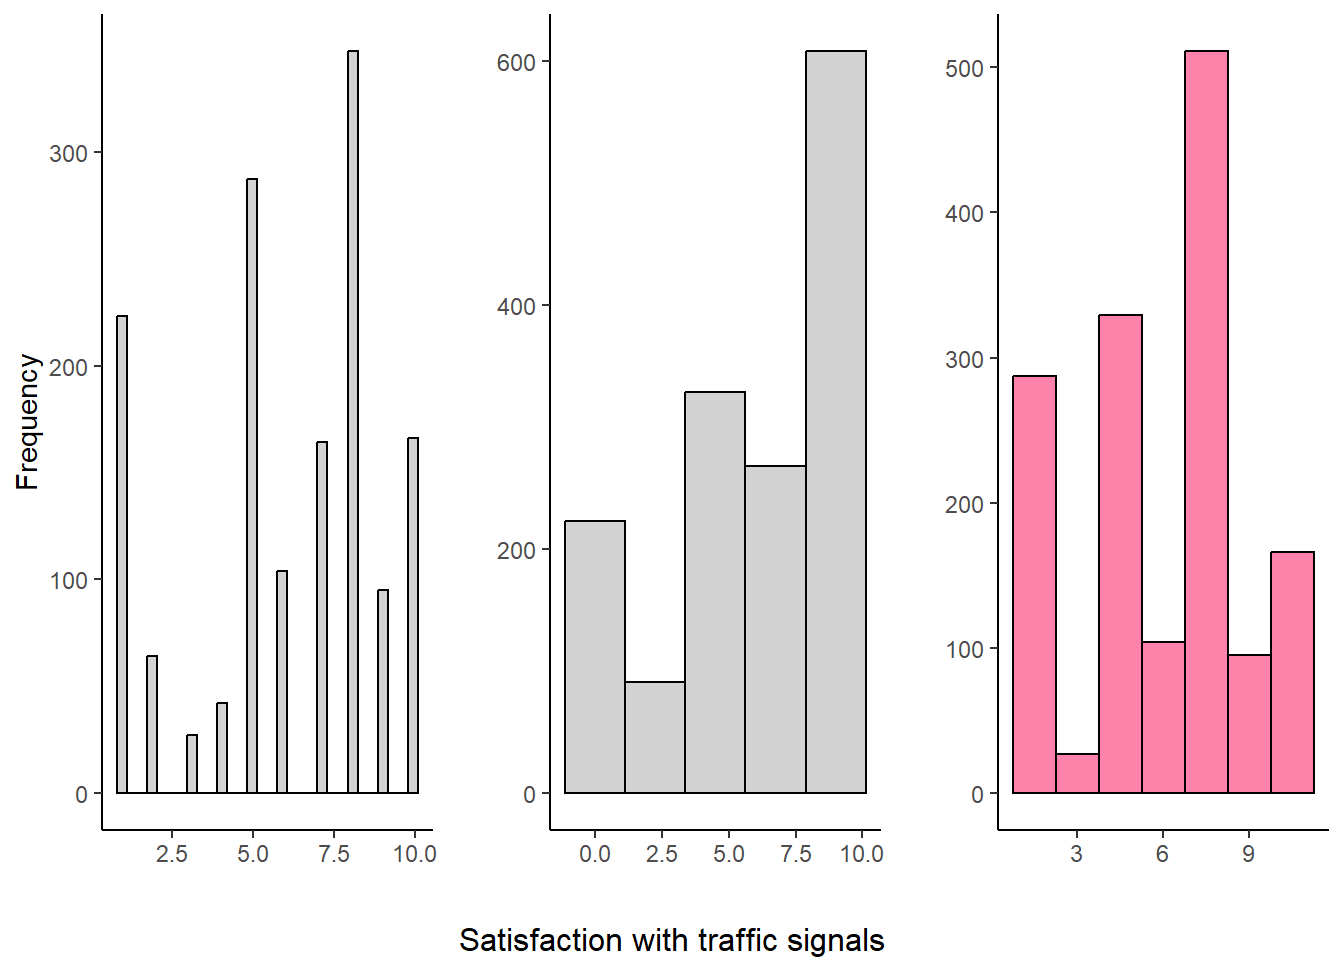
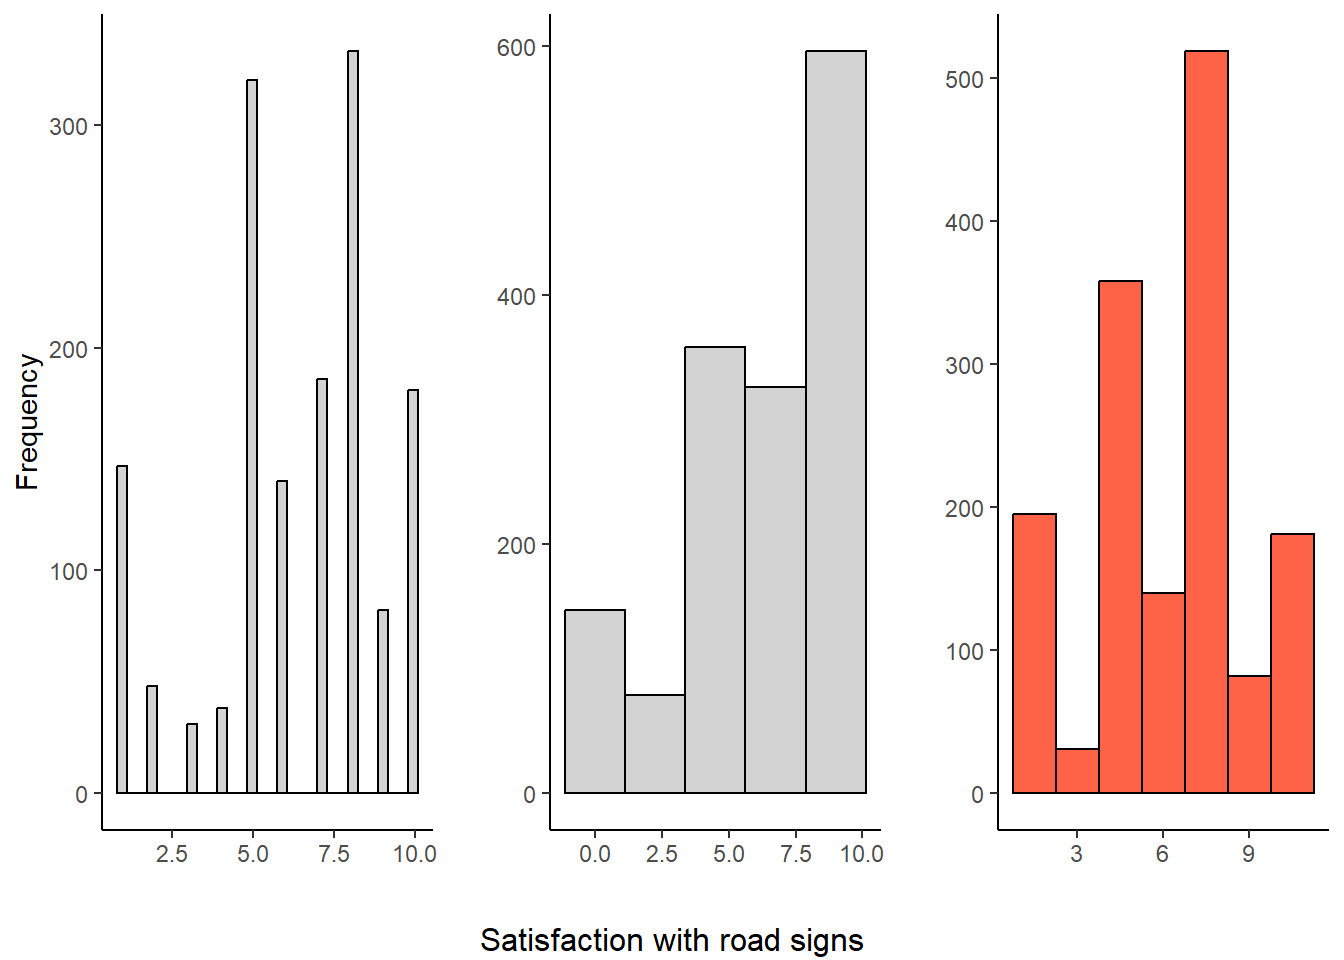
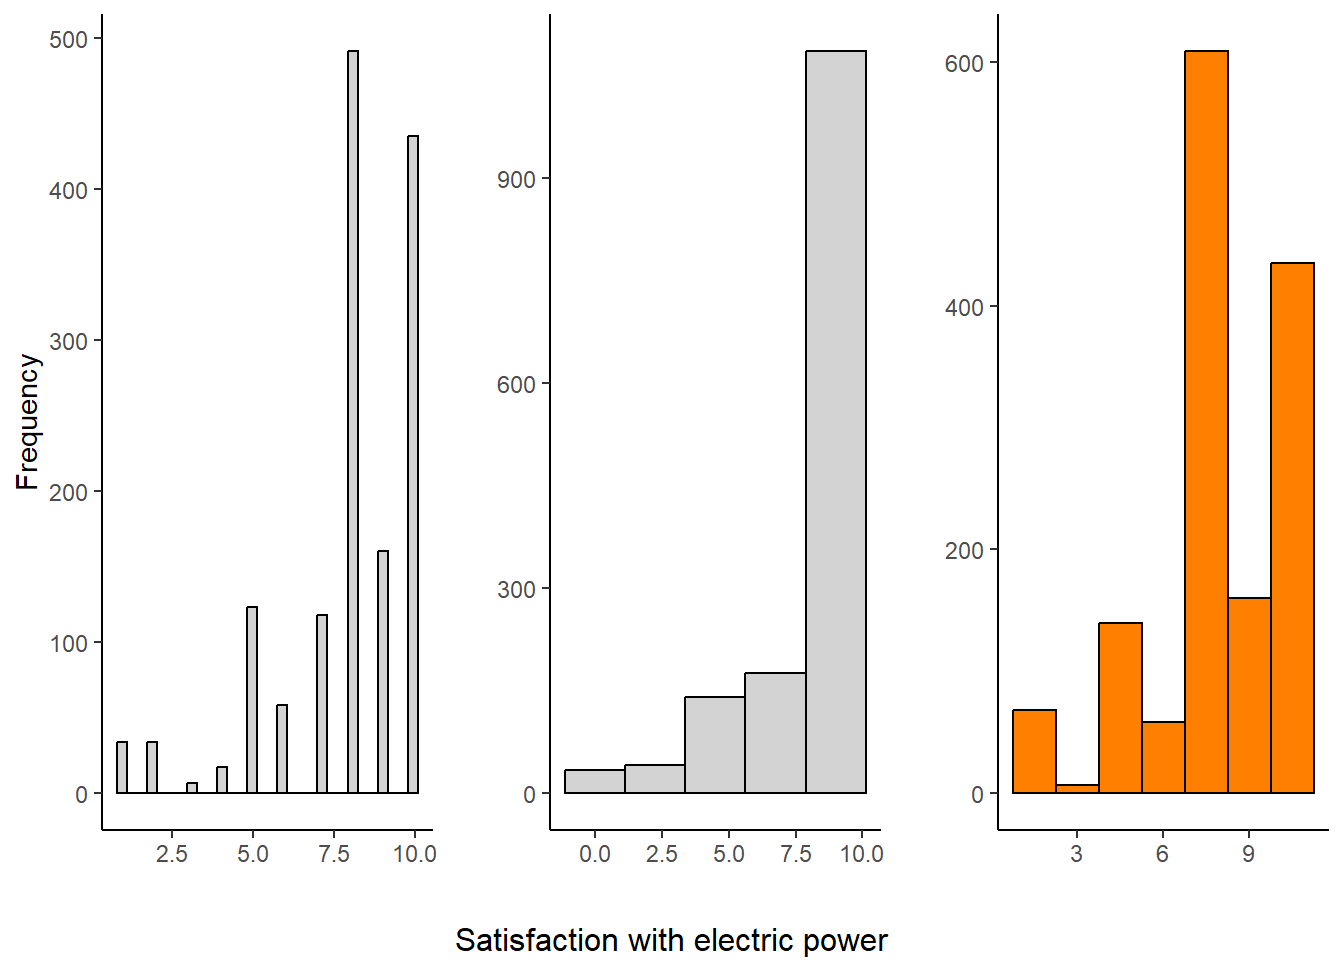
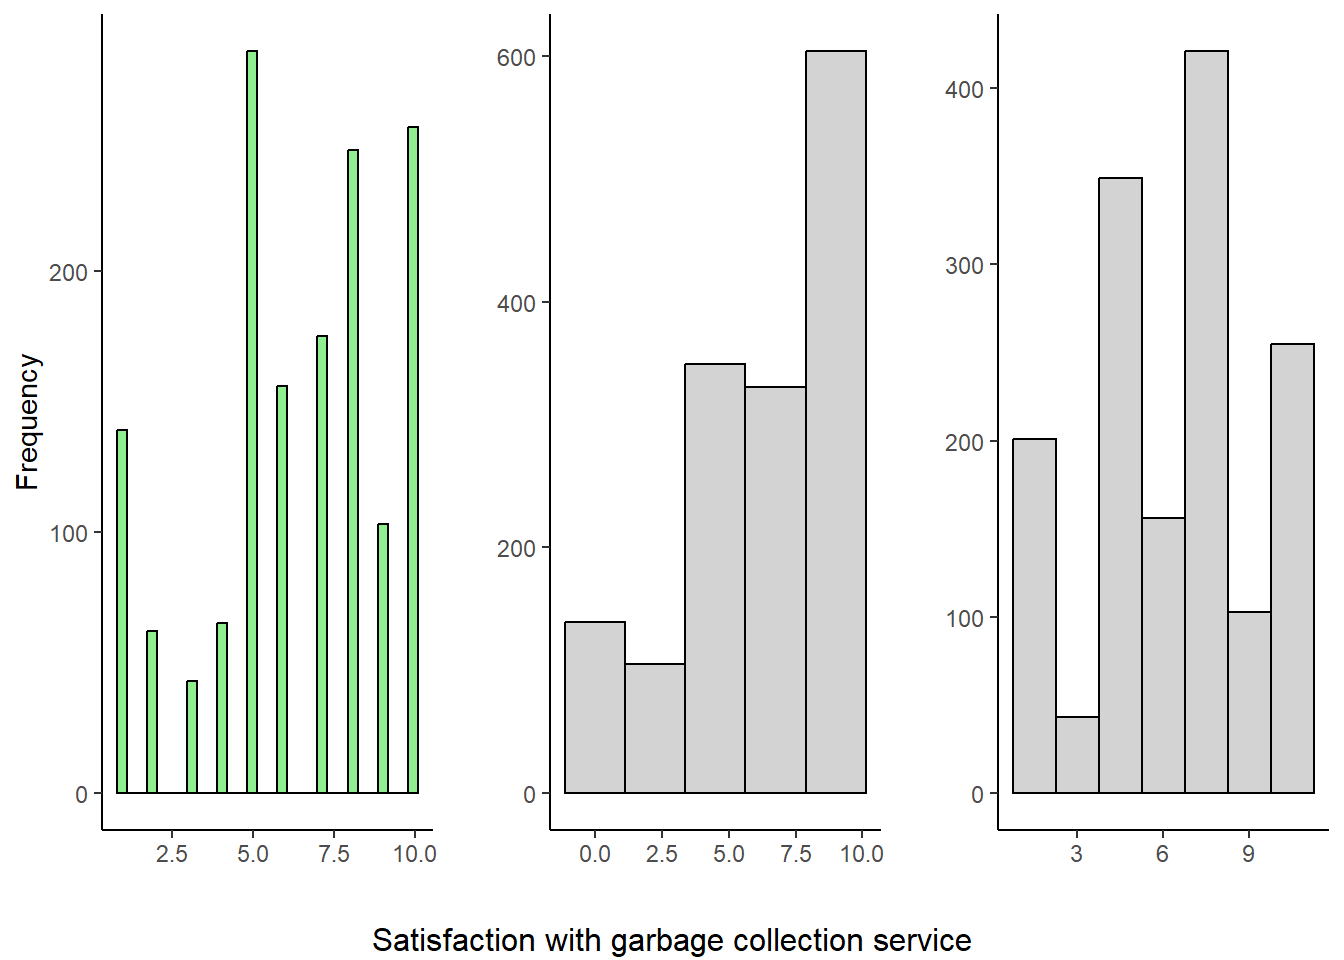
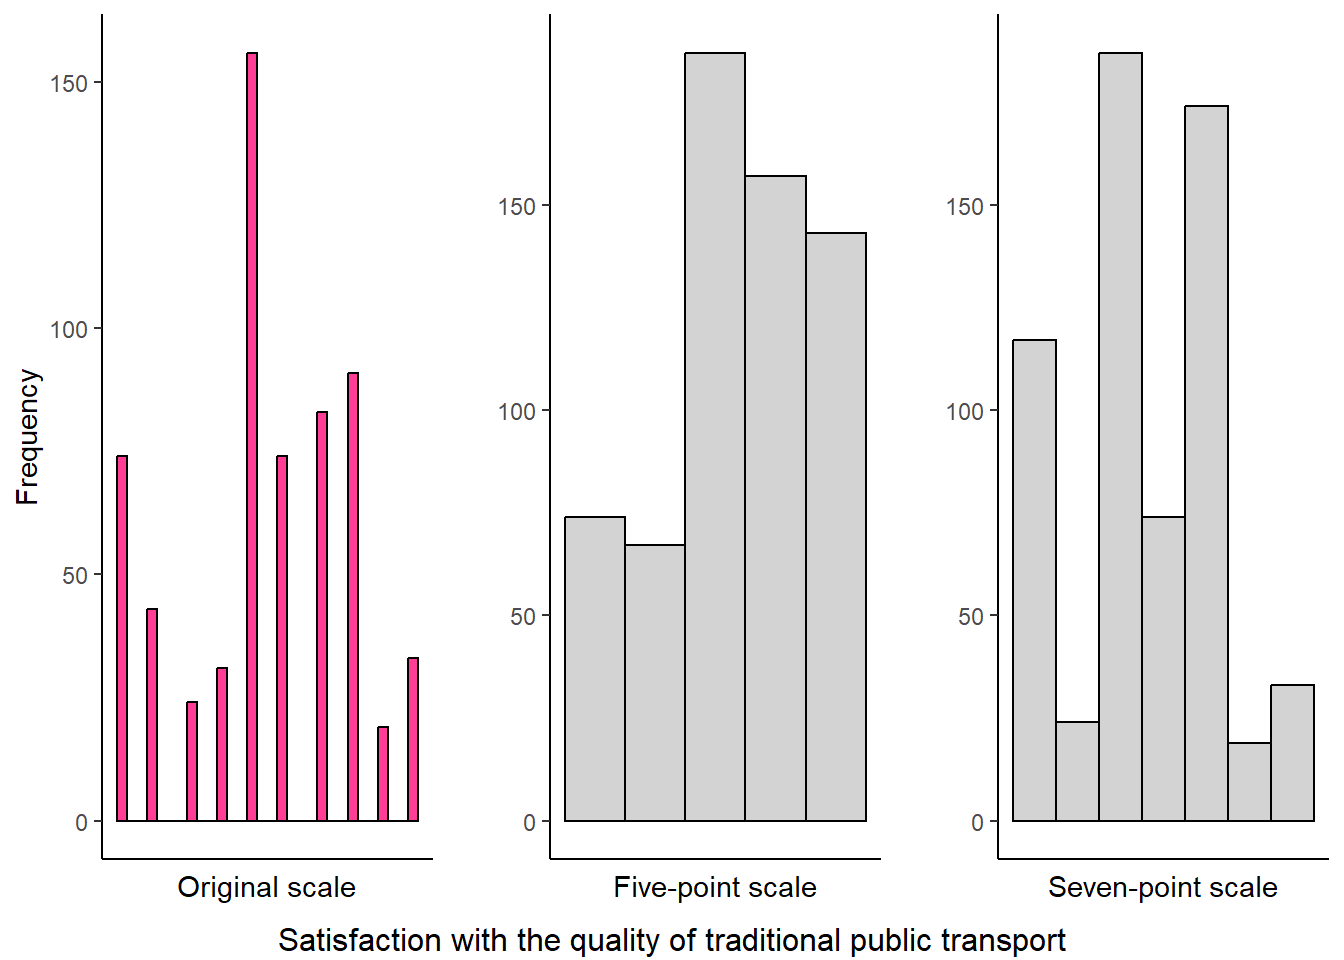
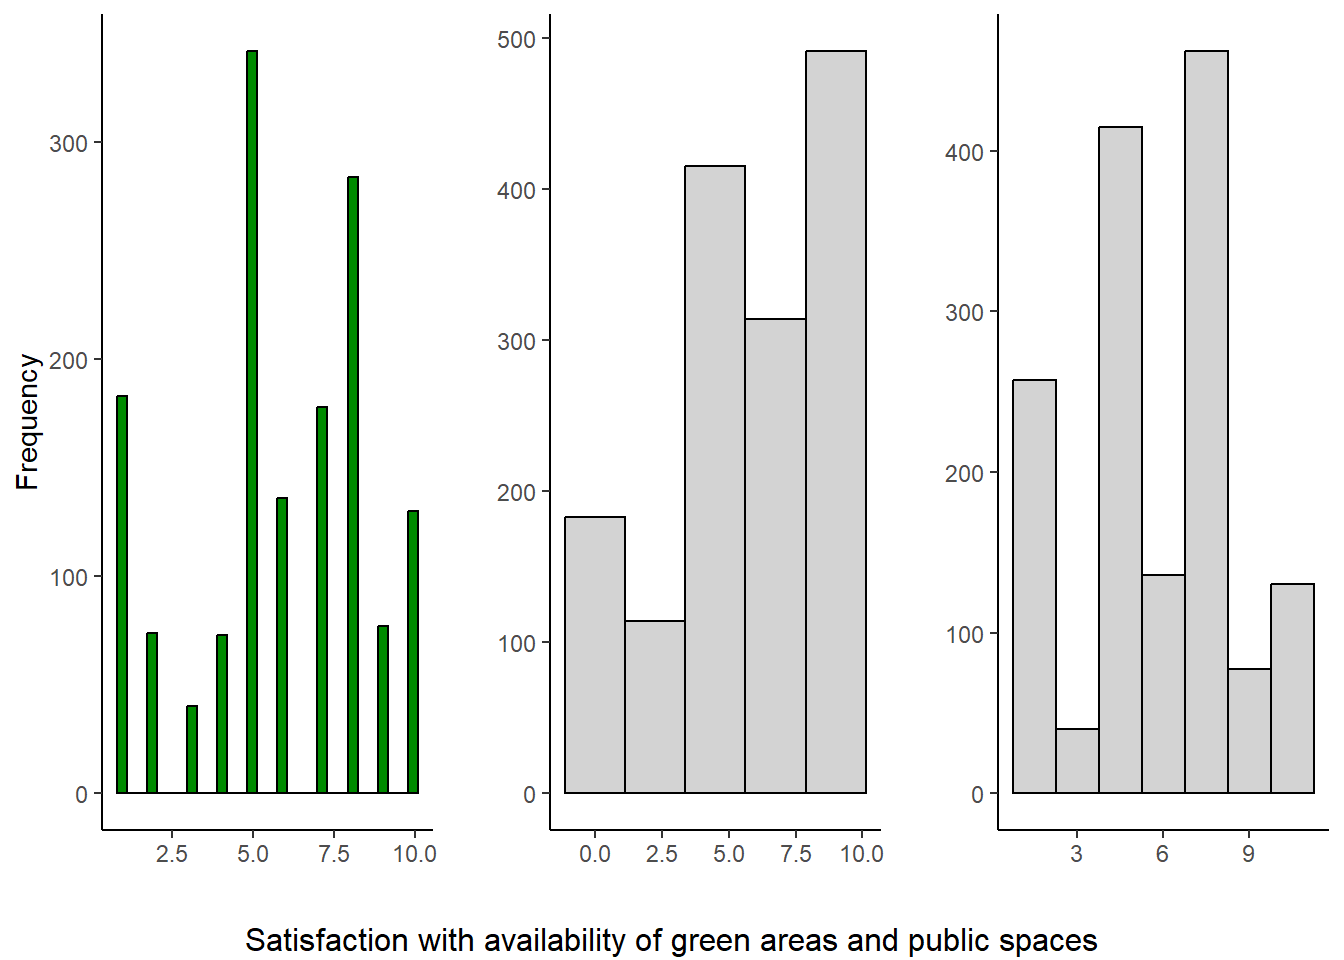
To determine if it would be convenient to use a smaller scale, I used a visual comparison between three histograms, one using the original scale and two using a 5 and 7 point scale. The histograms were created using the ggplot2 package. If the histograms with reduced scales are similar to the original ten-point one, it is concluded that the survey could benefit from its reduction.
In the case of satisfaction reports for water, electric power, lighting, signage, traffic signals and semi-massive transport services, the seven-point scales replicate the distribution of the original scale, indicating that reducing the scale would not result in significant information loss.
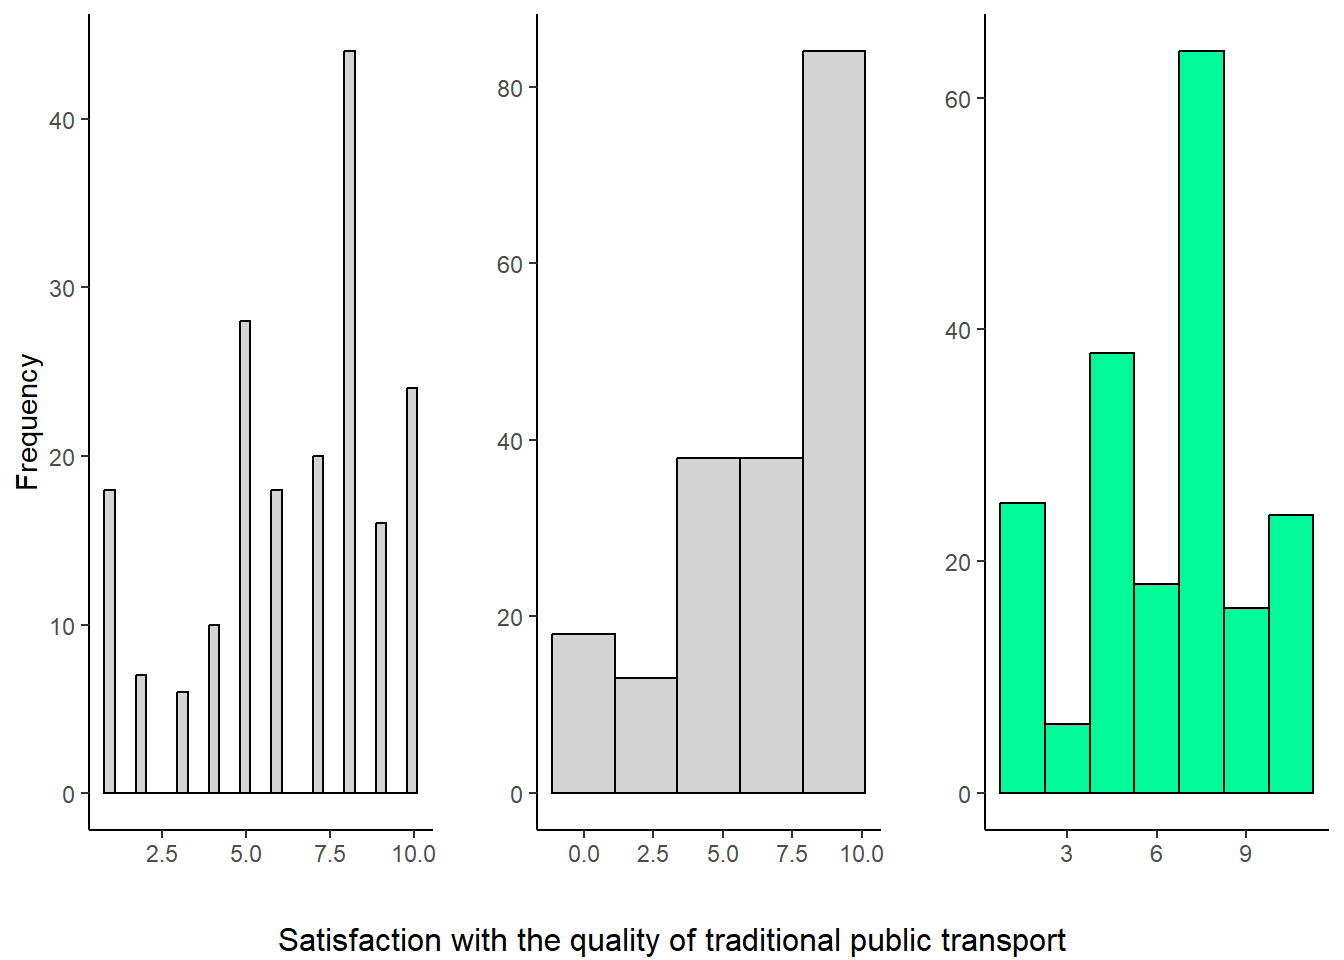
In contrast, satisfaction reports for garbage collection, traditional transport, paving, green areas and public spaces services show that the reduced scales have a different distribution from the original scale. Based on this information, modifying the scales is not recommended due to information loss that would alter the interpretation of results.

Conclusion
The results of the visual analysis suggest that in some cases scale reduction could benefit the stability of the information obtained. However, in other questions such reduction led to information loss and potential misinterpretation of results. While the scales of the questions indicated in the previous section (i.e., water, electric power, lighting, signage, traffic signals and semi-massive transport) could be reduced, the cognitive load of changing scales according to the question may affect participants’ responses. An interesting aspect of the results is that three of the four questions that are affected by the scale change (Paving, green areas, and traditional public transport) are the areas with the lowest average satisfaction, indicating greater dispersion of data across different response options.
References
Finn, R. H. (1972). Effects of Some Variations in Rating Scale Characteristics on the Means and Reliabilities of Ratings. Educational and Psychological Measurement, 32(2), 255-265. https://doi-org.proxy.lib.ohio-state.edu/10.1177/001316447203200203.